
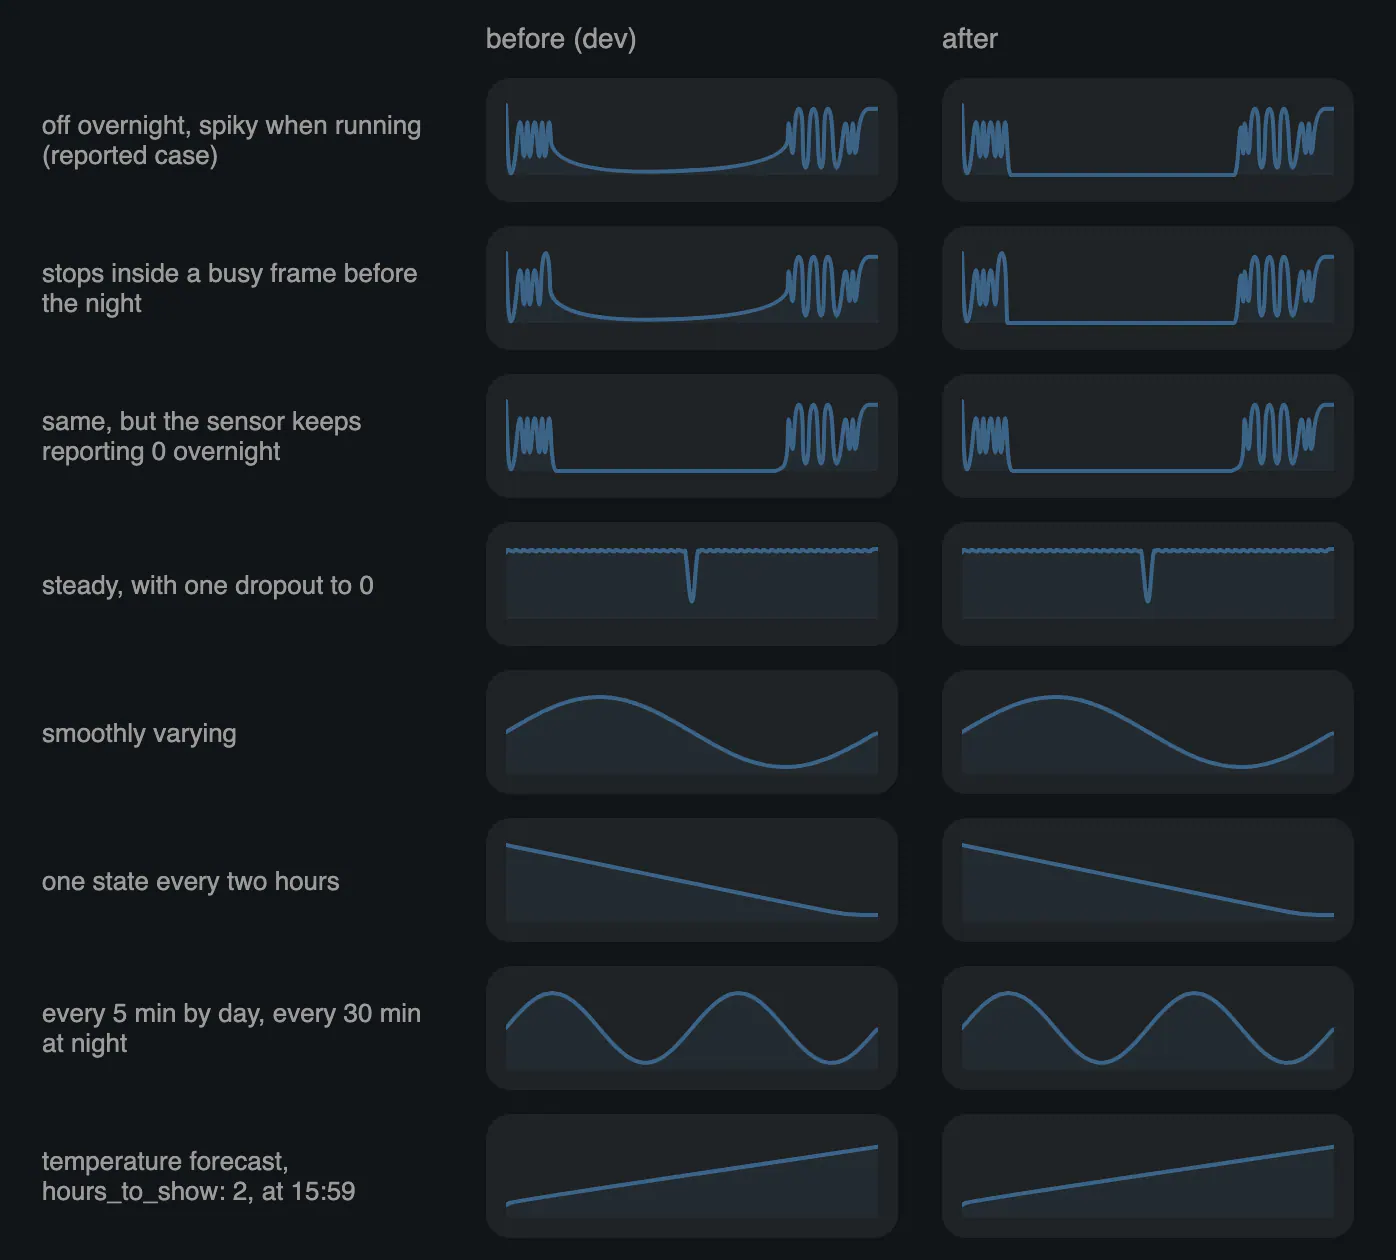

Home Assistant’s history graphs hold a sensor’s last value across long gaps between recorded changes. A fan that stayed off all night could previously look as though it gradually ramped up, because the line curved toward the next value before that change happened.
The correction preserves the flat stretch through graph sampling and keeps the transition near the recorded change. An unavailable reading does not create a hold, and forecasts and histories without a sufficiently long gap keep their existing curves.